
Self-driving cars, electric vehicles, and the technology behind them are reshaping transportation — MOTO invests across that value chain.
Semiconductors, batteries, sensors, charging infrastructure and self-driving software, alongside the vehicles themselves.
Electrification and autonomy are still early in reshaping how people and goods move.
The Adviser has contractually agreed to limit the Fund's total annual operating expenses to 0.68% through June 30, 2029.
| Period | Fund NAV | Market price | Index* |
|---|---|---|---|
| 1 month | -5.23% | -6.38% | -0.77% |
| 6 month | -11.27% | -12.74% | 4.94% |
| YTD | 8.11% | 7.23% | 10.89% |
| 1 year | 8.13% | 7.26% | 12.11% |
| 3 year | 19.58% | 18.96% | 22.26% |
| 5 year | 5.58% | 5.20% | 10.49% |
| Since inception | 14.53% | 14.23% | 13.12% |
| Period | Fund NAV | Market price | Index* |
|---|---|---|---|
| 1 month | -1.13% | -1.07% | -1.19% |
| 6 month | 11.90% | 10.67% | 15.89% |
| YTD | 14.07% | 14.54% | 11.75% |
| 1 year | 19.48% | 20.79% | 15.24% |
| 3 year | 17.04% | 16.99% | 21.38% |
| 5 year | 8.14% | 8.11% | 11.88% |
| Since inception | 15.62% | 15.52% | 13.42% |
*The fund Benchmark Index is the MSCI World Index NR. The MSCI World Index is a broad global equity index that represents large- and mid-cap equity performance across 23 developed markets countries. It covers approximately 85% of the free float-adjusted market capitalization in each country and does not offer exposure to emerging markets. Index figures are shown on a net return (NR) basis, meaning dividends are reinvested after the deduction of withholding taxes applicable to non-resident institutional investors. An investor cannot invest directly in an index.
Market Price: The current price at which shares are bought and sold. Market returns are based upon the last trade price.
NAV: The dollar value of a single share, based on the value of the underlying assets of the fund minus its liabilities, divided by the number of shares outstanding. Calculated at the end of each business day.
Shares of ETFs are bought and sold at market price (not NAV) and are not individually redeemed from the Fund. Brokerage commissions will reduce returns. GAFunds NAVs are calculated using prices as of 4:00 PM Eastern Time. The closing price is the Mid-Point between the Bid and Ask price as of the close of exchange. Closing price returns do not represent the returns you would receive if you traded shares at other times.
Performance data quoted represents past performance and is no guarantee of future results. Investment returns and principal value of an investment will fluctuate so that an investor's shares, when redeemed, may be worth more or less than their original cost. Current performance may be lower or higher than quoted. Performance data for the most recent month-end is available above.
Fund holdings and sector allocations are subject to change.
The Morningstar Rating™ for funds, or “star rating,” is calculated for managed products (including mutual funds, variable annuity and variable life subaccounts, exchange-traded funds, closed-end funds, and separate accounts) with at least a three-year history. Exchange-traded funds and open-ended mutual funds are considered a single population for comparative purposes. It is calculated based on a Morningstar Risk-Adjusted Return measure that accounts for variation in a managed product’s monthly excess performance, placing more emphasis on downward variations and rewarding consistent performance. The top 10% of products in each product category receive 5 stars, the next 22.5% receive 4 stars, the next 35% receive 3 stars, the next 22.5% receive 2 stars, and the bottom 10% receive 1 star. The Overall Morningstar Rating for a managed product is derived from a weighted average of the performance figures associated with its three-, five-, and 10-year (if applicable) Morningstar Rating metrics. The weights are: 100% three-year rating for 36-59 months of total returns, 60% five-year rating/40% three-year rating for 60-119 months of total returns, and 50% 10-year rating/30% five-year rating/20% three-year rating for 120 or more months of total returns. While the 10-year overall star rating formula seems to give the most weight to the 10-year period, the most recent three-year period actually has the greatest impact because it is included in all three rating periods. Past performance is no guarantee of future results.
| Net Assets % | Ticker | Name | Description | Market Price ($) | Shares Held | Market Value ($) | CUSIP |
|---|---|---|---|---|---|---|---|
| 5.56% | TSM | TAIWAN SEMICONDUCTOR-SP ADR | COMMON STOCK | 388.62 | 1,010 | 392,506.20 | 874039100 |
| 5.17% | PWR | QUANTA SERVICES INC | COMMON STOCK | 591.48 | 617 | 364,943.16 | 74762E102 |
| 4.96% | APH | AMPHENOL CORP-CL A | COMMON STOCK | 80.71 | 4,340 | 350,281.40 | 032095101 |
| 4.78% | ADI | ANALOG DEVICES INC | COMMON STOCK | 394.66 | 855 | 337,434.30 | 032654105 |
| 4.01% | NVDA | NVIDIA CORP | COMMON STOCK | 178.67 | 1,584 | 283,013.28 | 67066G104 |
| 3.78% | IFX | INFINEON TECHNOLOGIES AG | COMMON STOCK | 54.57 | 4,895 | 267,105.35 | D35415104 |
| 3.77% | SIE.GY | SIEMENS AG-REG | COMMON STOCK | 304.12 | 875 | 266,101.67 | D69671218 |
| 3.76% | ETN | EATON CORP PLC | COMMON STOCK | 359.30 | 739 | 265,522.70 | G29183103 |
| 3.71% | GOOG | ALPHABET INC-CL C | COMMON STOCK | 286.01 | 915 | 261,699.15 | 02079K107 |
| 3.58% | VOLVB | VOLVO AB-B SHS | COMMON STOCK | 32.29 | 7,830 | 252,792.05 | 928856301 |
| 3.53% | TEL | TE CONNECTIVITY PLC | COMMON STOCK | 218.75 | 1,140 | 249,375.00 | G87052109 |
| 3.45% | NXPI | NXP SEMICONDUCTORS NV | COMMON STOCK | 256.42 | 950 | 243,599.00 | N6596X109 |
| 3.30% | TSLA | TESLA INC | COMMON STOCK | 378.05 | 617 | 233,256.85 | 88160R101 |
| 2.92% | ST | SENSATA TECHNOLOGIES HOLDPLC | COMMON STOCK | 40.63 | 5,070 | 205,994.10 | G8060N102 |
| 2.83% | DAN | DANA INC | COMMON STOCK | 23.11 | 8,655 | 200,017.05 | 235825205 |
| 2.71% | 270 | KIA CORP | COMMON STOCK | 72.36 | 2,640 | 191,023.22 | Y47601102 |
| 2.58% | HEXAB | HEXAGON AB-B SHS | COMMON STOCK | 10.94 | 16,660 | 182,293.94 | W4R431112 |
| 2.46% | 1211 | BYD CO LTD-H | COMMON STOCK | 9.24 | 18,800 | 173,691.16 | Y1023R104 |
| 2.45% | USD | CASHUSD | CASH | 1.00 | 173,129 | 173,129.14 | CASHUSD |
| 2.43% | 6723 | RENESAS ELECTRONICS CORP | COMMON STOCK | 16.21 | 10,600 | 171,822.04 | J4881V107 |
| 2.42% | 175 | GEELY AUTOMOBILE HOLDING | COMMON STOCK | 1.84 | 93,000 | 170,894.62 | G3777B103 |
| 2.41% | ON | ON SEMICONDUCTOR | COMMON STOCK | 69.11 | 2,465 | 170,356.15 | 682189105 |
| 2.34% | JMAT | JOHNSON MATTHEY PLC | COMMON STOCK | 32.53 | 5,074 | 165,067.67 | G51604174 |
| 2.31% | 006400 | SAMSUNG SDI CO LTD | COMMON STOCK | 309.57 | 527 | 163,143.29 | Y74866107 |
| 2.26% | DAR | DARLING INGREDIENTS INC | COMMON STOCK | 52.53 | 3,040 | 159,691.20 | 237266101 |
| 1.99% | 6902 | DENSO CORP | COMMON STOCK | 12.23 | 11,500 | 140,636.48 | J12075107 |
| 1.94% | SWKS | SKYWORKS SOLUTIONS INC | COMMON STOCK | 82.83 | 1,655 | 137,083.65 | 83088M102 |
| 1.69% | CON | CONTINENTAL AG | COMMON STOCK | 81.36 | 1,470 | 119,598.46 | D16212140 |
| 1.69% | MBG | MERCEDES-BENZ GROUP AG | COMMON STOCK | 46.98 | 2,545 | 119,552.12 | D1668R123 |
| 1.69% | POWI | POWER INTEGRATIONS INC | COMMON STOCK | 44.29 | 2,690 | 119,140.10 | 739276103 |
| 1.39% | THRM | GENTHERM INC | COMMON STOCK | 30.38 | 3,240 | 98,431.20 | 37253A103 |
| 1.26% | VOW3 | VOLKSWAGENWERK AG PRF | COMMON STOCK | 78.78 | 1,130 | 89,019.64 | D94523103 |
| 1.17% | APTV | APTIV PLC | COMMON STOCK | 39.91 | 2,070 | 82,613.70 | G3265R107 |
| 1.03% | 051910 | LG CHEM LTD | COMMON STOCK | 164.11 | 445 | 73,028.64 | Y52758102 |
| 0.70% | DTG | DAIMLER TRUCK HOLDING AG | COMMON STOCK | 46.87 | 1,061 | 49,733.63 | D1T3RZ100 |
| 0.49% | OCTVSDB | OCTAVE INTELLIGENCE PLC- | COMMON STOCK | 20.79 | 1,666 | 34,639.25 | G6S37X104 |
| 0.41% | MBLY | MOBILEYE GLOBAL INC-A | COMMON STOCK | 5.86 | 5,000 | 29,300.00 | 60741F104 |
| 0.41% | VGNT | VERSIGENT PLC | COMMON STOCK | 41.62 | 690 | 28,717.80 | G9600F104 |
| 0.37% | AMV0 | AUMOVIO SE | COMMON STOCK | 35.29 | 745 | 26,293.43 | D0R9B8108 |
| 0.27% | — | NET OTHER ASSETS | OTHER | 1.00 | 19,220 | 19,220.02 | — |
| Net Assets % | Ticker | Name | Description | Market Price ($) | Shares Held | Market Value ($) | CUSIP |
|---|---|---|---|---|---|---|---|
| 5.54% | TSM | TAIWAN SEMICONDUCTOR-SP ADR | COMMON STOCK | 375.44 | 1,010 | 379,194.40 | 874039100 |
| 4.88% | PWR | QUANTA SERVICES INC | COMMON STOCK | 540.90 | 617 | 333,735.30 | 74762E102 |
| 4.73% | APH | AMPHENOL CORP-CL A | COMMON STOCK | 74.59 | 4,340 | 323,720.60 | 032095101 |
| 4.54% | ADI | ANALOG DEVICES INC | COMMON STOCK | 363.56 | 855 | 310,843.80 | 032654105 |
| 4.32% | NVDA | NVIDIA CORP | COMMON STOCK | 186.64 | 1,584 | 295,637.76 | 67066G104 |
| 3.80% | GOOG | ALPHABET INC-CL C | COMMON STOCK | 283.93 | 915 | 259,795.95 | 02079K107 |
| 3.76% | SIE.GY | SIEMENS AG-REG | COMMON STOCK | 293.79 | 875 | 257,062.04 | D69671218 |
| 3.69% | ETN | EATON CORP PLC | COMMON STOCK | 341.72 | 739 | 252,531.08 | G29183103 |
| 3.65% | IFX | INFINEON TECHNOLOGIES AG | COMMON STOCK | 50.98 | 4,895 | 249,570.58 | D35415104 |
| 3.62% | VOLVB | VOLVO AB-B SHS | COMMON STOCK | 31.60 | 7,830 | 247,436.35 | 928856301 |
| 3.45% | TEL | TE CONNECTIVITY PLC | COMMON STOCK | 207.01 | 1,140 | 235,991.40 | G87052109 |
| 3.45% | NXPI | NXP SEMICONDUCTORS NV | COMMON STOCK | 248.29 | 950 | 235,875.50 | N6596X109 |
| 3.23% | TSLA | TESLA INC | COMMON STOCK | 358.22 | 617 | 221,021.74 | 88160R101 |
| 2.91% | ST | SENSATA TECHNOLOGIES HOLDPLC | COMMON STOCK | 39.31 | 5,070 | 199,301.70 | G8060N102 |
| 2.84% | 270 | KIA CORP | COMMON STOCK | 73.55 | 2,640 | 194,183.13 | Y47601102 |
| 2.72% | DAN | DANA INC | COMMON STOCK | 21.50 | 8,655 | 186,082.50 | 235825205 |
| 2.64% | 006400 | SAMSUNG SDI CO LTD | COMMON STOCK | 343.20 | 527 | 180,868.57 | Y74866107 |
| 2.64% | HEXAB | HEXAGON AB-B SHS | COMMON STOCK | 10.84 | 16,660 | 180,596.66 | W4R431112 |
| 2.60% | 1211 | BYD CO LTD-H | COMMON STOCK | 9.46 | 18,800 | 177,812.08 | Y1023R104 |
| 2.53% | USD | CASHUSD | CASH | 1.00 | 173,129 | 173,129.14 | CASHUSD |
| 2.52% | 175 | GEELY AUTOMOBILE HOLDING | COMMON STOCK | 1.86 | 93,000 | 172,717.59 | G3777B103 |
| 2.42% | 6723 | RENESAS ELECTRONICS CORP | COMMON STOCK | 15.63 | 10,600 | 165,708.61 | J4881V107 |
| 2.38% | JMAT | JOHNSON MATTHEY PLC | COMMON STOCK | 32.04 | 5,074 | 162,570.96 | G51604174 |
| 2.28% | ON | ON SEMICONDUCTOR | COMMON STOCK | 63.31 | 2,465 | 156,059.15 | 682189105 |
| 2.23% | DAR | DARLING INGREDIENTS INC | COMMON STOCK | 50.19 | 3,040 | 152,577.60 | 237266101 |
| 1.99% | SWKS | SKYWORKS SOLUTIONS INC | COMMON STOCK | 82.19 | 1,655 | 136,024.45 | 83088M102 |
| 1.97% | 6902 | DENSO CORP | COMMON STOCK | 11.74 | 11,500 | 135,005.99 | J12075107 |
| 1.72% | MBG | MERCEDES-BENZ GROUP AG | COMMON STOCK | 46.30 | 2,545 | 117,845.56 | D1668R123 |
| 1.68% | CON | CONTINENTAL AG | COMMON STOCK | 78.38 | 1,470 | 115,218.40 | D16212140 |
| 1.58% | POWI | POWER INTEGRATIONS INC | COMMON STOCK | 40.26 | 2,690 | 108,299.40 | 739276103 |
| 1.40% | THRM | GENTHERM INC | COMMON STOCK | 29.47 | 3,240 | 95,482.80 | 37253A103 |
| 1.29% | VOW3 | VOLKSWAGENWERK AG PRF | COMMON STOCK | 77.82 | 1,130 | 87,939.66 | D94523103 |
| 1.19% | APTV | APTIV PLC | COMMON STOCK | 39.44 | 2,070 | 81,640.80 | G3265R107 |
| 1.11% | 051910 | LG CHEM LTD | COMMON STOCK | 170.14 | 445 | 75,710.24 | Y52758102 |
| 0.70% | DTG | DAIMLER TRUCK HOLDING AG | COMMON STOCK | 45.12 | 1,061 | 47,870.21 | D1T3RZ100 |
| 0.51% | OCTVSDB | OCTAVE INTELLIGENCE PLC- | COMMON STOCK | 20.82 | 1,666 | 34,688.70 | G6S37X104 |
| 0.42% | MBLY | MOBILEYE GLOBAL INC-A | COMMON STOCK | 5.73 | 5,000 | 28,650.00 | 60741F104 |
| 0.41% | VGNT | VERSIGENT PLC | COMMON STOCK | 40.96 | 690 | 28,262.40 | G9600F104 |
| 0.39% | AMV0 | AUMOVIO SE | COMMON STOCK | 35.49 | 745 | 26,440.39 | D0R9B8108 |
| 0.28% | — | NET OTHER ASSETS | OTHER | 1.00 | 19,331 | 19,331.23 | — |
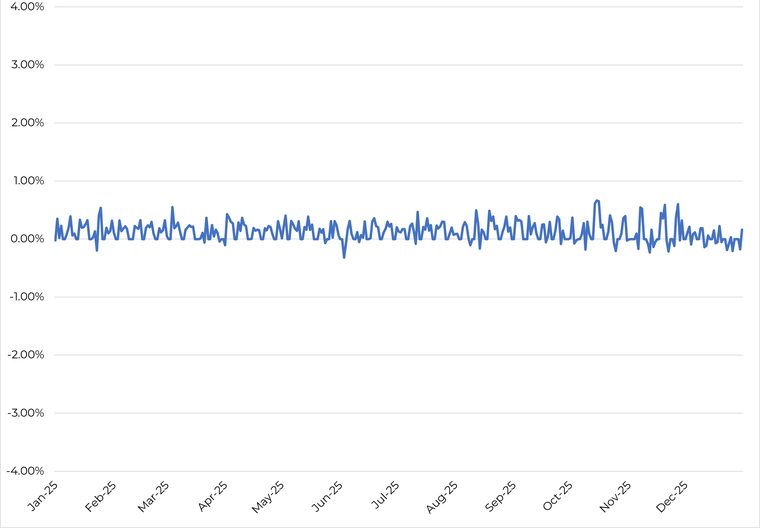
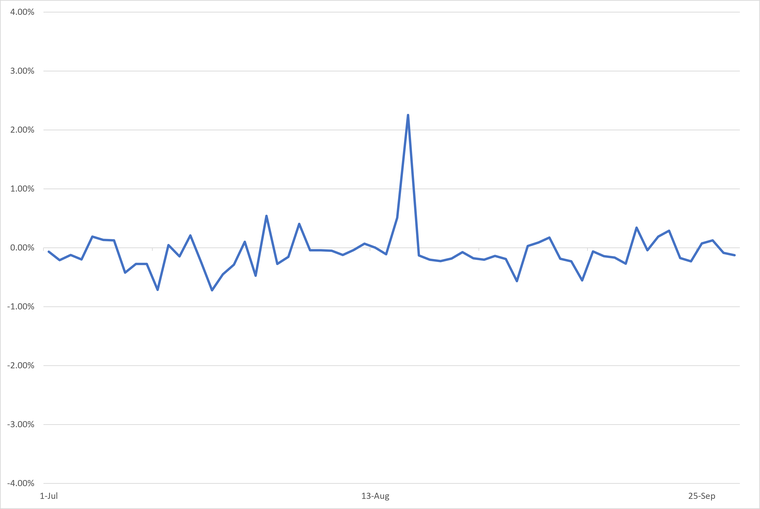
| Period | Days at a premium | Days at a discount |
|---|---|---|
| Calendar Year 2025 | 38 | 212 |
| Q1 2026 | 20 | 41 |
| Q2 2026 | 37 | 25 |
| Q3 2026 | 20 | 44 |
The premium/discount exceeded ±2% on 1 trading day during this period — not for more than seven consecutive trading days, so no additional Rule 6c-11 statement is required.
The Fund's shares are bought and sold at market price, which may differ from NAV.
| Ex-date | Record date | Pay date | Income | Short-term gain | Long-term gain |
|---|---|---|---|---|---|
| 12/12/2025 | 12/12/2025 | 12/22/2025 | $0.5627 per share | none | none |
| 12/13/2024 | 12/13/2024 | 12/23/2024 | $0.4515 per share | none | none |
| 12/8/2023 | 12/11/2023 | 12/18/2023 | $0.4171 per share | $0.3911 per share | $0.3325 per share |
| 12/2/2022 | 12/5/2022 | 12/12/2022 | $0.79 per share | $0.03 per share | none |
| 12/3/2021 | 12/6/2021 | 12/7/2021 | $0.22 per share | $0.04 per share | none |
Important risk information. Investing involves risk, including possible loss of principal. International investments may involve risk of capital loss from unfavorable fluctuation in currency values, from differences in generally accepted accounting principles or from social, economic or political instability in other nations. Emerging markets involve heightened risks related to the same factors as well as increased volatility and lower trading volume. The companies in which the Fund invests may be subject to rapid changes in technology, intense competition, rapid obsolescence of products and services, loss of intellectual property protections, evolving industry standards and frequent new product introductions and changes in business cycles and government regulations. These risks could adversely affect the value of companies in which the Fund invests. Limitations on applications for autonomous or electric vehicles could adversely affect the value of companies in which the Fund invests.
Shares of an ETF are bought and sold at market price (not NAV) and are not individually redeemed from the fund. Brokerage commissions will reduce returns. The Fund is distributed by Foreside Fund Services, LLC, which is not affiliated with Guinness Atkinson Asset Management, Inc. Carefully consider the fund's investment objectives, risks, charges and expenses before investing; this and other information is in the prospectus, which should be read carefully before investing.