
High-quality dividend growth potential across the fast-growing Asia-Pacific region — income built on quality, not the highest headline yield.
Quality Asia-Pacific companies that pair rising earnings with a real commitment to paying dividends.
The same focus on durable, growing dividends that anchors our global strategy, applied to the region.
The Adviser has contractually agreed to limit the Fund's total annual operating expenses to 0.78% through June 30, 2029. 30-day SEC yield as of 5/31/2026. The 30-Day SEC Yield is a standardized measure of a fund's net investment income over the trailing 30 days. The subsidized yield reflects fee waivers and/or expense reimbursements in effect during the period; the unsubsidized yield removes those waivers and reimbursements and would be lower.
| Period | Fund NAV | Market price | Index* |
|---|---|---|---|
| YTD | 10.13% | 9.99% | 23.80% |
| 1 year | 12.48% | 11.03% | 28.20% |
| 3 year | 18.29% | 18.37% | 23.94% |
| 5 year | 8.89% | 8.86% | 9.21% |
| 10 year | 8.79% | 8.75% | 9.54% |
| Since inception | 7.00% | 6.86% | 7.69% |
| Period | Fund NAV | Market price | Index* |
|---|---|---|---|
| YTD | 10.13% | 9.99% | 23.80% |
| 1 year | 12.48% | 11.03% | 28.20% |
| 3 year | 18.29% | 18.37% | 23.94% |
| 5 year | 8.89% | 8.86% | 9.21% |
| 10 year | 8.79% | 8.75% | 9.54% |
| Since inception | 7.00% | 6.86% | 7.69% |
*The fund Benchmark Index is the MSCI AC Pacific ex-Japan Index NR. The MSCI AC Pacific ex Japan Index captures large- and mid-cap representation across the developed and emerging markets of the Pacific region, excluding Japan, and covers approximately 85% of the free float-adjusted market capitalization in each country. Index figures are shown on a net return (NR) basis, meaning dividends are reinvested after the deduction of withholding taxes applicable to non-resident institutional investors. An investor cannot invest directly in an index.
The GAFunds Asia Pacific Dividend Builder ETF acquired the assets and liabilities of the predecessor mutual fund, the Guinness Atkinson Asia Pacific Dividend Builder Fund, on March 26, 2021. As a result of the transaction, the Fund adopted the accounting and performance history of its predecessor mutual fund. Performance results shown prior to March 26, 2021, reflect the performance of the predecessor mutual fund. The Market Price returns shown prior to March 26, 2021 reflects the predecessor mutual fund's NAV.
Market Price: The current price at which shares are bought and sold. Market returns are based upon the last trade price.
NAV: The dollar value of a single share, based on the value of the underlying assets of the fund minus its liabilities, divided by the number of shares outstanding. Calculated at the end of each business day.
Shares of ETFs are bought and sold at market price (not NAV) and are not individually redeemed from the Fund. Brokerage commissions will reduce returns. GAFunds NAVs are calculated using prices as of 4:00 PM Eastern Time. The closing price is the Mid-Point between the Bid and Ask price as of the close of exchange. Closing price returns do not represent the returns you would receive if you traded shares at other times.
Effective as of the close of business on March 26, 2021, the fund acquired the assets and assumed the performance, financial and other historical information of the Guinness Atkinson Asia Pacific Dividend Builder Fund, an open-end mutual fund (incepted March 31, 2006). The fund's investment objectives, strategies and policies are substantially similar to those of the predecessor mutual fund and it was managed by the same portfolio managers. Performance information for periods prior to March 26, 2021 is the historical performance of the predecessor mutual fund and reflects the higher operating expenses of the predecessor mutual fund. The fund has lower expenses than the predecessor mutual fund (including a lower management fee). For periods prior to March 26, 2021, the fund's performance would have been higher than shown had it operated with the fund's current expense levels.
Performance data quoted represents past performance and is no guarantee of future results. Investment returns and principal value of an investment will fluctuate so that an investor's shares, when redeemed, may be worth more or less than their original cost. Current performance may be lower or higher than quoted. Performance data for the most recent month-end is available above.
Fund holdings and sector allocations are subject to change.
The Morningstar Rating™ for funds, or “star rating,” is calculated for managed products (including mutual funds, variable annuity and variable life subaccounts, exchange-traded funds, closed-end funds, and separate accounts) with at least a three-year history. Exchange-traded funds and open-ended mutual funds are considered a single population for comparative purposes. It is calculated based on a Morningstar Risk-Adjusted Return measure that accounts for variation in a managed product’s monthly excess performance, placing more emphasis on downward variations and rewarding consistent performance. The top 10% of products in each product category receive 5 stars, the next 22.5% receive 4 stars, the next 35% receive 3 stars, the next 22.5% receive 2 stars, and the bottom 10% receive 1 star. The Overall Morningstar Rating for a managed product is derived from a weighted average of the performance figures associated with its three-, five-, and 10-year (if applicable) Morningstar Rating metrics. The weights are: 100% three-year rating for 36-59 months of total returns, 60% five-year rating/40% three-year rating for 60-119 months of total returns, and 50% 10-year rating/30% five-year rating/20% three-year rating for 120 or more months of total returns. While the 10-year overall star rating formula seems to give the most weight to the 10-year period, the most recent three-year period actually has the greatest impact because it is included in all three rating periods. Past performance is no guarantee of future results.
| Net Assets % | Ticker | Name | Description | Market Price ($) | Shares Held | Market Value ($) | CUSIP |
|---|---|---|---|---|---|---|---|
| 3.78% | 939 | CHINA CONSTRUCTION BANK- | COMMON STOCK | 1.31 | 1,550,000 | 2,027,448.26 | Y1397N101 |
| 3.73% | 1398 | IND & COMM BK OF CHINA-H | COMMON STOCK | 1.01 | 1,988,000 | 2,000,963.81 | Y3990B112 |
| 3.62% | DBS | DBS GROUP HOLDINGS LTD | COMMON STOCK | 57.22 | 33,905 | 1,940,195.35 | Y20246107 |
| 3.43% | 003690 | KOREAN REINSURANCE CO | COMMON STOCK | 10.47 | 175,252 | 1,835,319.74 | Y49391108 |
| 3.21% | 3968 | CHINA MERCHANTS BANK-H | COMMON STOCK | 6.95 | 247,500 | 1,721,237.02 | Y14896115 |
| 3.17% | TECHM | TECH MAHINDRA LTD | COMMON STOCK | 18.87 | 90,096 | 1,699,926.32 | Y85491127 |
| 3.16% | TSM | TAIWAN SEMICONDUCTOR-SP ADR | COMMON STOCK | 406.13 | 4,164 | 1,691,125.32 | 874039100 |
| 3.03% | 600887 | INNER MONGOLIA YILI INDU | COMMON STOCK | 4.53 | 358,500 | 1,624,610.15 | Y40847108 |
| 3.03% | 3034 | NOVATEK MICROELECTRONICS | COMMON STOCK | 17.63 | 92,100 | 1,623,616.52 | Y64153102 |
| 3.01% | AFL | AFLAC INC | COMMON STOCK | 123.89 | 13,036 | 1,615,030.04 | 001055102 |
| 3.01% | 8464 | NIEN MADE ENTERPRISE CO | COMMON STOCK | 11.34 | 142,000 | 1,610,816.45 | Y6349P112 |
| 3.00% | MTS | METCASH LTD | COMMON STOCK | 2.26 | 712,439 | 1,608,625.86 | Q6014C106 |
| 2.97% | 002032 | ZHEJIANG SUPOR COOKWARE | COMMON STOCK | 6.42 | 248,094 | 1,592,270.40 | Y98925103 |
| 2.94% | 2313 | SHENZHOU INTERNATIONAL G | COMMON STOCK | 4.88 | 322,700 | 1,575,681.58 | G8087W101 |
| 2.90% | 1193 | CHINA RESOURCES GAS GROU | COMMON STOCK | 2.08 | 746,800 | 1,553,800.24 | G2113B108 |
| 2.88% | NTES | NETEASE INC-ADR | COMMON STOCK | 113.64 | 13,574 | 1,542,549.36 | 64110W102 |
| 2.88% | 2388 | BOC HONG KONG HOLDINGS L | COMMON STOCK | 6.44 | 239,500 | 1,541,940.50 | Y0920U103 |
| 2.68% | JBH | JB HI-FI LTD | COMMON STOCK | 51.26 | 27,969 | 1,433,796.88 | Q5029L101 |
| 2.66% | TISCO/F | TISCO FINANCIAL-FOREIGN | COMMON STOCK | 3.69 | 386,000 | 1,422,857.14 | Y8843E171 |
| 2.62% | 688 | CHINA OVERSEAS LAND & IN | COMMON STOCK | 1.62 | 866,000 | 1,401,039.03 | Y15004107 |
| 2.61% | 388 | HONG KONG EXCHANGES & CL | COMMON STOCK | 46.84 | 29,800 | 1,395,809.46 | Y3506N139 |
| 2.59% | SHL | SONIC HEALTHCARE LTD | COMMON STOCK | 13.77 | 100,679 | 1,385,900.49 | Q8563C107 |
| 2.58% | PBK | PUBLIC BANK BERHAD | COMMON STOCK | 1.17 | 1,179,800 | 1,381,328.57 | Y71497104 |
| 2.57% | CICT | CAPITALAND INTEGRATED CO | REIT - Real Estate Investment Trust | 1.78 | 771,800 | 1,376,974.06 | Y0259J109 |
| 2.56% | 6690 | HAIER SMART HOME CO LTD- | COMMON STOCK | 2.54 | 540,000 | 1,373,432.69 | Y298BN100 |
| 2.54% | BBRI | BANK RAKYAT INDONESIA PE | COMMON STOCK | 0.15 | 8,801,200 | 1,359,633.66 | Y0697U112 |
| 2.53% | AVGO | BROADCOM INC | COMMON STOCK | 326.08 | 4,158 | 1,355,840.64 | 11135F101 |
| 2.51% | QCOM | QUALCOMM INC | COMMON STOCK | 164.79 | 8,165 | 1,345,510.35 | 747525103 |
| 2.49% | 2317 | HON HAI PRECISION INDUST | COMMON STOCK | 7.53 | 177,417 | 1,335,373.38 | Y36861105 |
| 2.44% | 2318 | PING AN INSURANCE GROUP | COMMON STOCK | 6.34 | 206,500 | 1,309,473.03 | Y69790106 |
| 2.41% | 002572 | SUOFEIYA HOME COLLECTION | COMMON STOCK | 1.12 | 1,149,400 | 1,288,791.63 | Y29336107 |
| 2.38% | CLAR | CAPITALAND ASCENDAS REIT | REIT - Real Estate Investment Trust | 1.73 | 737,198 | 1,274,860.19 | Y0205X103 |
| 2.38% | 2383 | ELITE MATERIAL CO LTD | COMMON STOCK | 143.33 | 8,890 | 1,274,205.17 | Y2290G102 |
| 2.25% | 867 | CHINA MEDICAL SYSTEM HOL | COMMON STOCK | 1.25 | 965,000 | 1,207,503.33 | G21108124 |
| 2.17% | 3008 | LARGAN PRECISION CO LTD | COMMON STOCK | 166.48 | 6,970 | 1,160,348.90 | Y52144105 |
| 1.17% | USD | CASHUSD | CASH | 1.00 | 625,173 | 625,172.81 | CASHUSD |
| 0.20% | CTD | CORPORATE TRAVEL MANAGEM | COMMON STOCK | 2.50 | 42,751 | 107,052.94 | Q2909K105 |
| Net Assets % | Ticker | Name | Description | Market Price ($) | Shares Held | Market Value ($) | CUSIP |
|---|---|---|---|---|---|---|---|
| 3.74% | 939 | CHINA CONSTRUCTION BANK- | COMMON STOCK | 1.29 | 1,550,000 | 2,001,210.81 | Y1397N101 |
| 3.68% | 1398 | IND & COMM BK OF CHINA-H | COMMON STOCK | 0.99 | 1,988,000 | 1,971,277.08 | Y3990B112 |
| 3.65% | DBS | DBS GROUP HOLDINGS LTD | COMMON STOCK | 57.64 | 33,905 | 1,954,148.15 | Y20246107 |
| 3.43% | 003690 | KOREAN REINSURANCE CO | COMMON STOCK | 10.47 | 175,252 | 1,835,668.04 | Y49391108 |
| 3.36% | TSM | TAIWAN SEMICONDUCTOR-SP ADR | COMMON STOCK | 431.81 | 4,164 | 1,798,056.84 | 874039100 |
| 3.15% | 3034 | NOVATEK MICROELECTRONICS | COMMON STOCK | 18.31 | 92,100 | 1,686,429.69 | Y64153102 |
| 3.13% | TECHM | TECH MAHINDRA LTD | COMMON STOCK | 18.59 | 90,096 | 1,674,637.69 | Y85491127 |
| 3.11% | 3968 | CHINA MERCHANTS BANK-H | COMMON STOCK | 6.72 | 247,500 | 1,663,984.83 | Y14896115 |
| 3.04% | 8464 | NIEN MADE ENTERPRISE CO | COMMON STOCK | 11.46 | 142,000 | 1,627,269.65 | Y6349P112 |
| 3.01% | AFL | AFLAC INC | COMMON STOCK | 123.54 | 13,036 | 1,610,467.44 | 001055102 |
| 2.97% | MTS | METCASH LTD | COMMON STOCK | 2.24 | 712,439 | 1,593,365.52 | Q6014C106 |
| 2.96% | 600887 | INNER MONGOLIA YILI INDU | COMMON STOCK | 4.42 | 358,500 | 1,586,056.80 | Y40847108 |
| 2.92% | 002032 | ZHEJIANG SUPOR COOKWARE | COMMON STOCK | 6.31 | 248,094 | 1,565,344.13 | Y98925103 |
| 2.84% | NTES | NETEASE INC-ADR | COMMON STOCK | 112.10 | 13,574 | 1,521,645.40 | 64110W102 |
| 2.83% | QCOM | QUALCOMM INC | COMMON STOCK | 185.41 | 8,165 | 1,513,872.65 | 747525103 |
| 2.83% | 1193 | CHINA RESOURCES GAS GROU | COMMON STOCK | 2.03 | 746,800 | 1,513,397.91 | G2113B108 |
| 2.81% | 2388 | BOC HONG KONG HOLDINGS L | COMMON STOCK | 6.29 | 239,500 | 1,507,329.85 | Y0920U103 |
| 2.81% | 2313 | SHENZHOU INTERNATIONAL G | COMMON STOCK | 4.66 | 322,700 | 1,504,507.52 | G8087W101 |
| 2.68% | AVGO | BROADCOM INC | COMMON STOCK | 345.00 | 4,158 | 1,434,510.00 | 11135F101 |
| 2.67% | TISCO/F | TISCO FINANCIAL-FOREIGN | COMMON STOCK | 3.71 | 386,000 | 1,430,901.54 | Y8843E171 |
| 2.58% | 388 | HONG KONG EXCHANGES & CL | COMMON STOCK | 46.37 | 29,800 | 1,381,753.76 | Y3506N139 |
| 2.57% | PBK | PUBLIC BANK BERHAD | COMMON STOCK | 1.17 | 1,179,800 | 1,374,665.35 | Y71497104 |
| 2.57% | CICT | CAPITALAND INTEGRATED CO | REIT - Real Estate Investment Trust | 1.78 | 771,800 | 1,374,285.60 | Y0259J109 |
| 2.55% | 2383 | ELITE MATERIAL CO LTD | COMMON STOCK | 153.92 | 8,890 | 1,368,364.62 | Y2290G102 |
| 2.55% | BBRI | BANK RAKYAT INDONESIA PE | COMMON STOCK | 0.15 | 8,801,200 | 1,364,113.18 | Y0697U112 |
| 2.52% | 688 | CHINA OVERSEAS LAND & IN | COMMON STOCK | 1.56 | 866,000 | 1,352,090.24 | Y15004107 |
| 2.52% | 2317 | HON HAI PRECISION INDUST | COMMON STOCK | 7.62 | 177,417 | 1,351,790.10 | Y36861105 |
| 2.52% | SHL | SONIC HEALTHCARE LTD | COMMON STOCK | 13.41 | 100,679 | 1,350,299.77 | Q8563C107 |
| 2.52% | JBH | JB HI-FI LTD | COMMON STOCK | 48.26 | 27,969 | 1,349,796.39 | Q5029L101 |
| 2.44% | 2318 | PING AN INSURANCE GROUP | COMMON STOCK | 6.32 | 206,500 | 1,305,955.90 | Y69790106 |
| 2.43% | 6690 | HAIER SMART HOME CO LTD- | COMMON STOCK | 2.41 | 540,000 | 1,303,543.21 | Y298BN100 |
| 2.40% | 002572 | SUOFEIYA HOME COLLECTION | COMMON STOCK | 1.12 | 1,149,400 | 1,286,387.30 | Y29336107 |
| 2.34% | CLAR | CAPITALAND ASCENDAS REIT | REIT - Real Estate Investment Trust | 1.70 | 737,198 | 1,255,099.10 | Y0205X103 |
| 2.32% | 3008 | LARGAN PRECISION CO LTD | COMMON STOCK | 178.65 | 6,970 | 1,245,216.44 | Y52144105 |
| 2.28% | 867 | CHINA MEDICAL SYSTEM HOL | COMMON STOCK | 1.26 | 965,000 | 1,218,856.74 | G21108124 |
| 1.17% | USD | CASHUSD | CASH | 1.00 | 625,173 | 625,172.81 | CASHUSD |
| 0.20% | CTD | CORPORATE TRAVEL MANAGEM | COMMON STOCK | 2.48 | 42,751 | 105,835.06 | Q2909K105 |
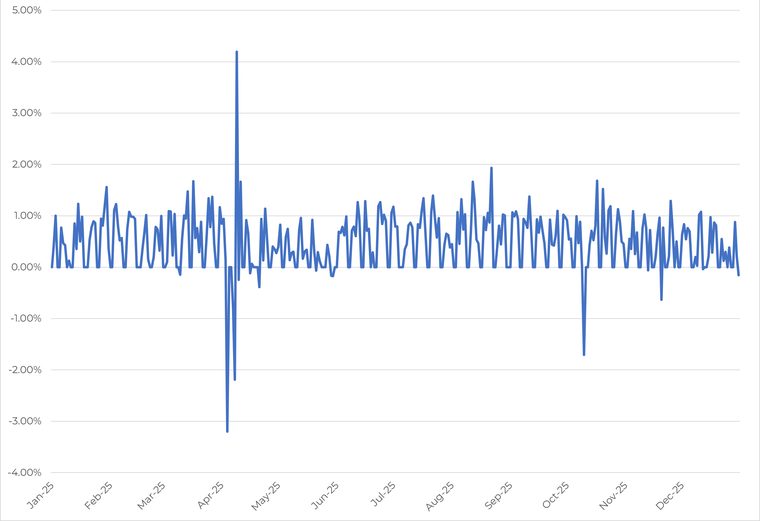
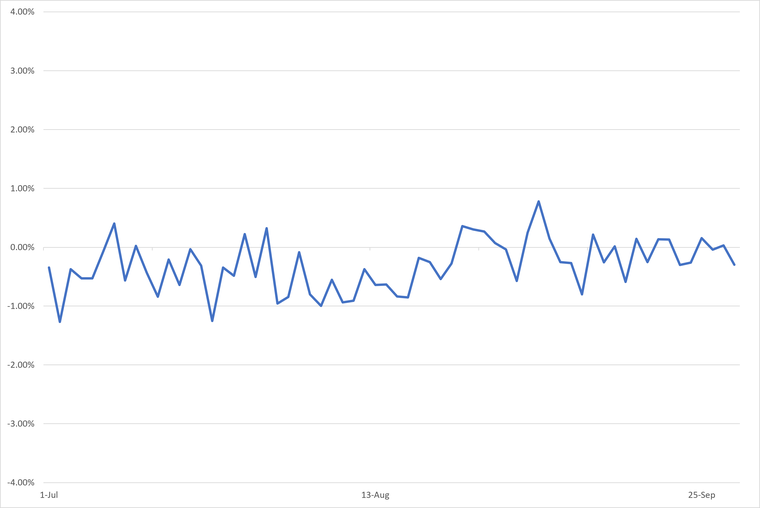
| Period | Days at a premium | Days at a discount |
|---|---|---|
| Calendar Year 2025 | 234 | 16 |
| Q1 2026 | 51 | 10 |
| Q2 2026 | 21 | 41 |
| Q3 2026 | 18 | 46 |
The premium/discount exceeded ±2% on 5 trading days during this period — not for more than seven consecutive trading days, so no additional Rule 6c-11 statement is required.
The Fund's shares are bought and sold at market price, which may differ from NAV.
| Ex-date | Record date | Pay date | Income | Short-term gain | Long-term gain |
|---|---|---|---|---|---|
| 3/20/2026 | 3/20/2026 | 3/27/2026 | $0.14 per share | none | none |
| 12/12/2025 | 12/12/2025 | 12/22/2025 | $0.1306 per share | $0.0181 per share | $0.0027 per share |
| 9/26/2025 | 9/26/2025 | 10/6/2025 | $0.12 per share | none | none |
| 6/27/2025 | 6/27/2025 | 7/7/2025 | $0.13 per share | none | none |
| 3/28/2025 | 3/28/2025 | 4/7/2025 | $0.10 per share | none | none |
| 12/13/2024 | 12/13/2024 | 12/23/2024 | $0.1302 per share | $0.0397 per share | $0.2603 per share |
| 9/27/2024 | 9/27/2024 | 10/7/2024 | $0.13 per share | none | none |
| 6/28/2024 | 6/28/2024 | 7/8/2024 | $0.12 per share | none | none |
| 3/28/2024 | 4/1/2024 | 4/8/2024 | $0.06 per share | none | none |
| 12/8/2023 | 12/11/2023 | 12/18/2023 | $0.2454 per share | none | $0.0423 per share |
| 9/29/2023 | 10/2/2023 | 10/10/2023 | $0.20 per share | none | none |
| 6/30/2023 | 7/3/2023 | 7/10/2023 | $0.12 per share | none | none |
| 3/31/2023 | 4/3/2023 | 4/10/2023 | $0.03 per share | none | none |
| 12/2/2022 | 12/5/2022 | 12/12/2022 | $0.12 per share | none | $0.00 per share |
| 9/30/2022 | 10/3/2022 | 10/11/2022 | $0.12 per share | none | none |
Important risk information. Investing involves risk, including possible loss of principal. Dividend Payment Risk: there is no guarantee securities held by the Fund will declare or pay dividends. Foreign & Emerging Markets Risk: investments in foreign securities involve greater volatility and political, economic and currency risks, heightened in emerging markets. The Fund is concentrated in a single region and is more exposed to that region's risks. See the prospectus for more information.
Shares of an ETF are bought and sold at market price (not NAV) and are not individually redeemed from the fund. Brokerage commissions will reduce returns. The Fund is distributed by Foreside Fund Services, LLC, which is not affiliated with Guinness Atkinson Asset Management, Inc. Carefully consider the fund's investment objectives, risks, charges and expenses before investing; this and other information is in the prospectus, which should be read carefully before investing.